Your cart is currently empty!
NetOne has nearly 2 million customers it is not chasing

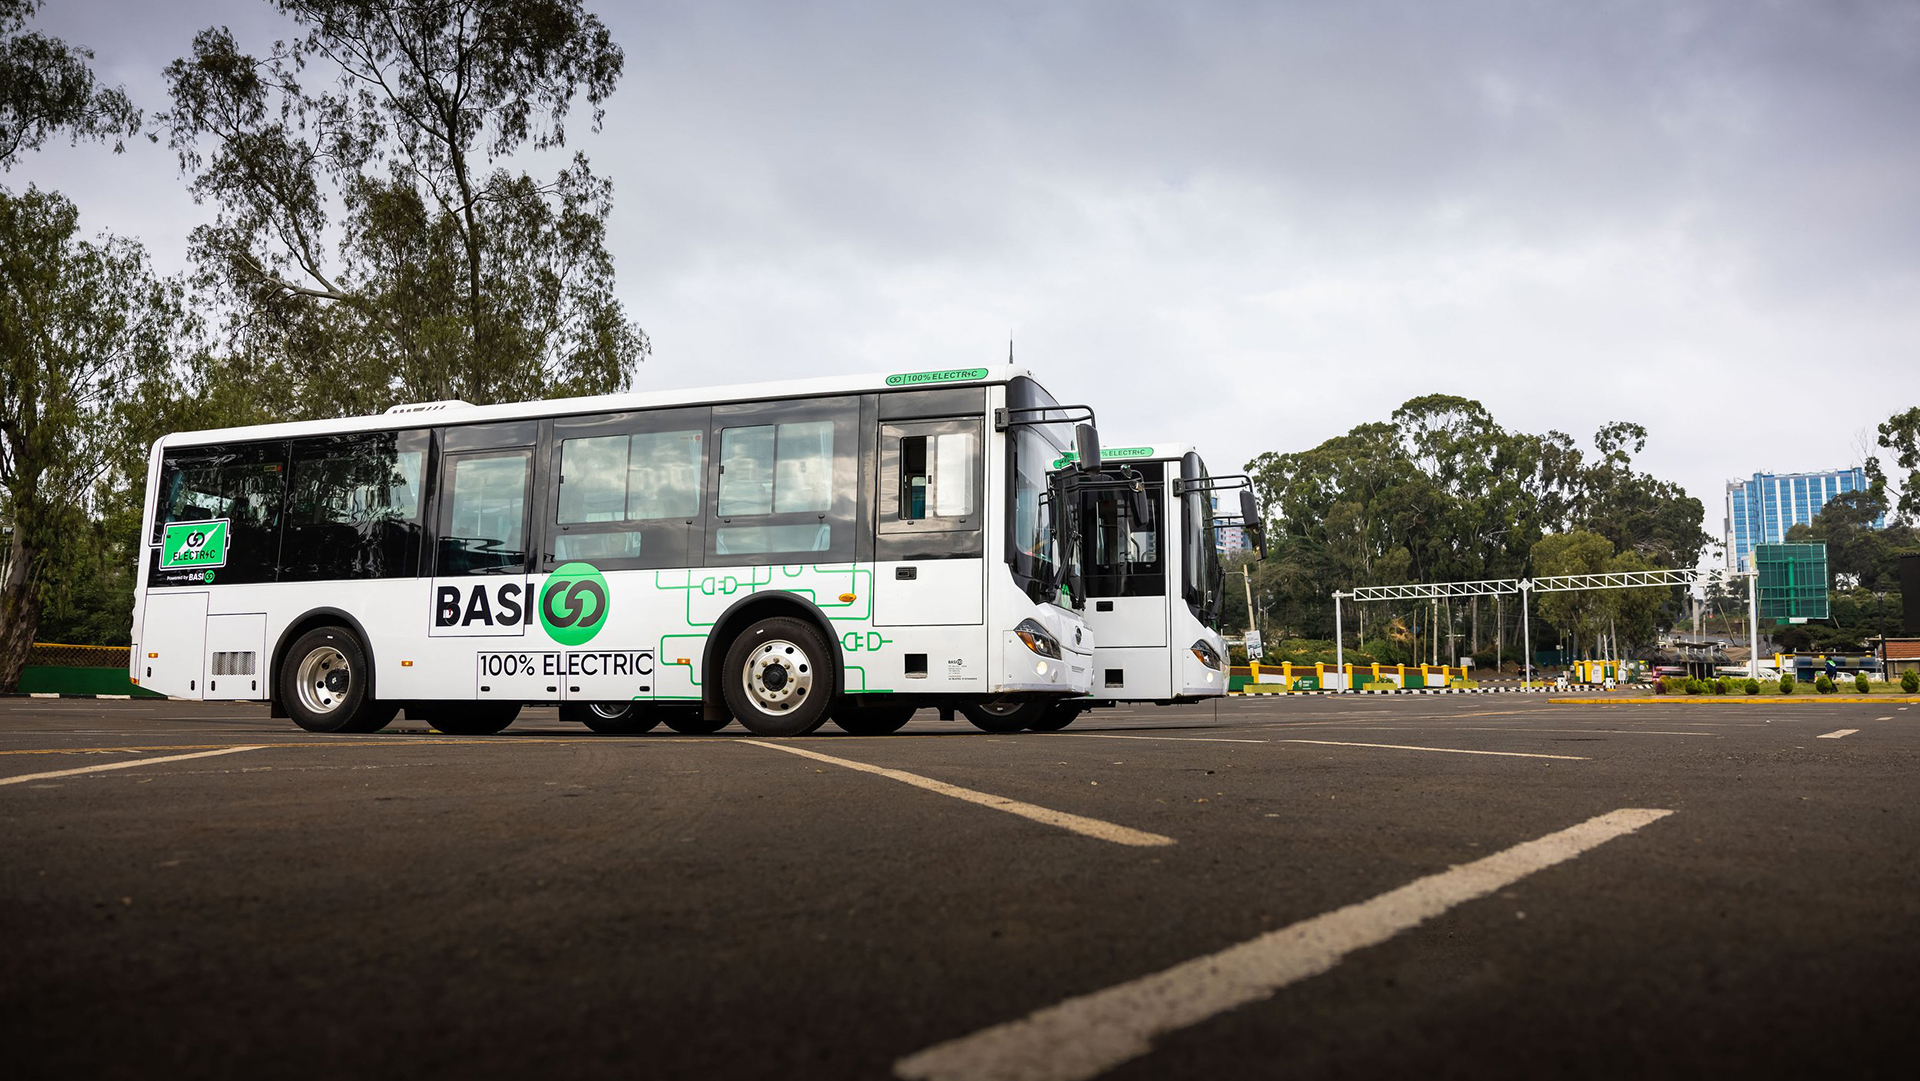
A carbon footprint that is tied to the recent extreme weather phenomena that have been plaguing parts of the planet, especially in the last decade. Looking at the mobility sector, electrification is the direction the industry is moving towards. In this report, we will observe whether or not electrifying the public transport sector in Africa is feasible.
Featured


Gain access to premium content and stay up to date with the latest insights
Unlock potential and investment opportunities with precise market insights from .zedw newsletter.


